Defector has partnered with Baseball Prospectus to bring you a taste of their work. They write good shit that we think you’ll like. If you do like it, we encourage you to check out their site and subscribe.
This story was originally published at Baseball Prospectus on June 25.
Last Tuesday, the league finally started their long-awaited, much-decried crackdown on the sticky substances pitchers had been using to goose their RPM for years. As Jonathan Judge noted last week, spin was already declining before MLB started their inspections, but the last few days have brought on such an amazingly precipitous decline in spin rates that it’s left us wondering where the bottom is. Looking at a decade of Statcast and PITCHf/x data suggests we may have many RPM yet to lose, and the consequences on the league’s offenses are going to be profound.
Pitchers didn’t wait for the league to start searching their underpants before they abandoned their sticky stuff en masse. Attention from the media and the public had been building for months, and MLB had been in conversations with the union about instituting a more strict sticky substance policy for weeks. A handful of pitchers–among them, Sticky Stuff Truther Trevor Bauer–had drops in the hundreds of RPM starting early on in June.
A closer look at the stats shows that pitchers actually started cleaning off their hands (and caps, and gloves, and arms, and…) as early as mid-May. Using a statistical approach that accounts for temperature and a lot of other factors that impact spin rates, Judge studied spin decline a couple of weeks ago, using the spin-to-velocity ratio (SVR). I bootstrapped on his methodology and applied it to daily average spin rates to find out when exactly pitchers started going clean.

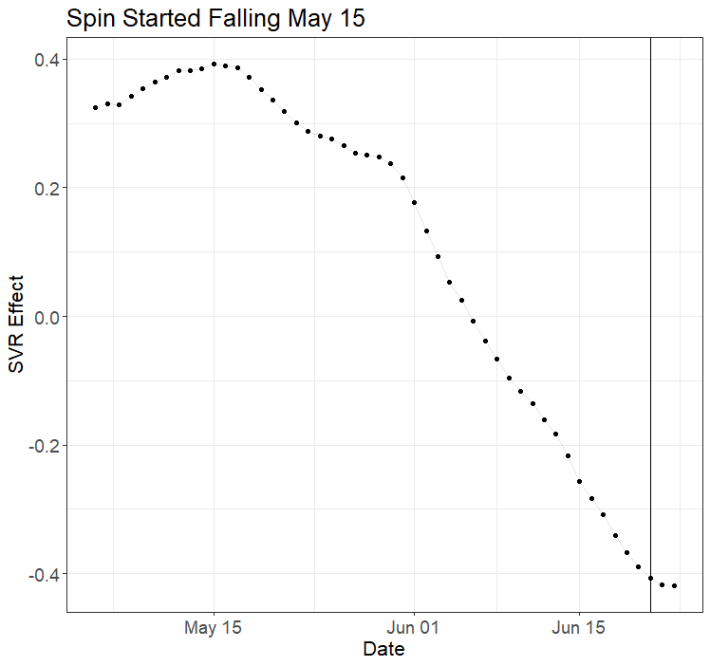
Zooming in on the last couple of months, it looks like spin hit its maximum point about halfway through May. It began to fall then, but took a nosedive at the start of June. (The black line represents the official start of the crackdown.) Since then, more and more pitchers have begun registering massive declines, presumably from abandoning substances like Spider Tack that can add hundreds of RPM.
Apparently, at least some hurlers waited until the crackdown to let go. A few days into the post-sticky stuff era, SVR continues to drop, though the slope of the line suggests the effect is leveling off. The latest data suggests the league at large is down about 0.8 SVR units, roughly half a standard deviation.
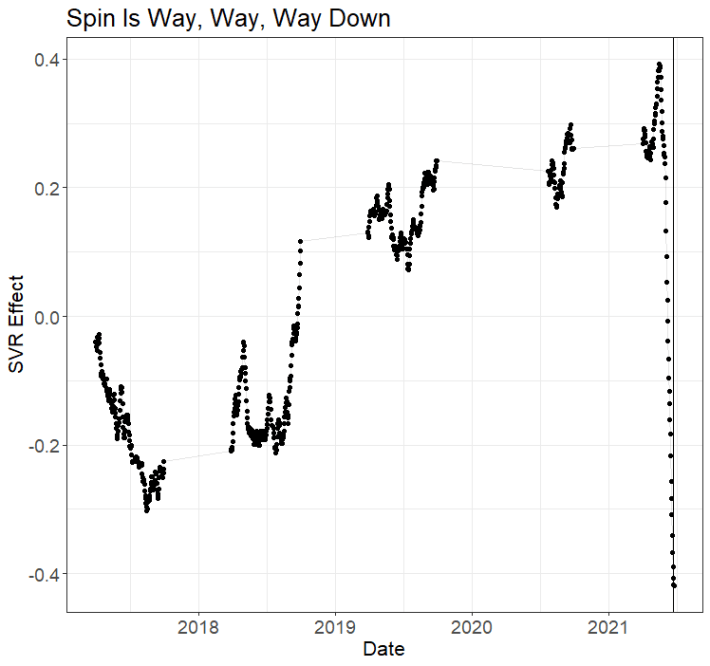
It’s hard to find a historical precedent for a league-average SVR ratio this low. To do it, we have to go back years and years into the past, when measuring spin was done differently. This analysis shows a gradual long-term trend towards ever-higher spin rates that accelerated this season before an abrupt reversal. Before, we might have credited improving spin rates to better player development; now, with the crackdown suddenly taking away all of those gains and more, it looks like the real explanation was sticky stuff.
The closest parallel to the current low level of spin rate is from the end of the 2017 season.

But spin rate has actually dropped even well below what it was then. Going back to 2016, there’s such a drastic change that the reduction in SVR appears to be a result of systematic measurement improvements (put into place in 2017) that may have affected the way Statcast computed spin rate. The 2016 season is from the early days of Statcast, when the system operated primarily off of radar, in contrast to the camera-based setup (with Hawkeye) in use now.
Even defaulting to 2017 or 2016’s spin rates is probably a bit optimistic. After all, the usage of sticky stuff is not something that started in 2017, or 2016–it’s been going on forever. New substances like Spider Tack that spike rotation drastically have created more variation between pitchers, and the massive drops we’re observing from guys like Bauer, Gerrit Cole, and others are evidence they’ve let that goop go. But if the league insists that even sunscreen is against the rules, then we could be looking at more units of SVR lost, and a major change in the strikeout rate.
We can estimate just how big thanks to work by Max Bay, Eno Sarris, and Brittany Ghiroli at The Athletic. They looked at the relationship between four-seam fastball SVR and strikeout percentage, finding that there was an approximately straight line that linked them: for every one unit increase in SVR, there was a roughly one percent increase in K rate.

We stand now at about 0.8 units of SVR lost, meaning that June and subsequent months should start to register a K% much closer to 2019 than the extremely high strikeout rate that has characterized this season. But if the trend continues we could be on track to nearly reverse the entire strikeout jump of the last few years.
Spin rate also impacts the value of batted ball contact. Batters are less likely to make solid contact on higher-spin fastballs and breakers. Indeed, exit velocity has crept up slightly since the beginning of June, and combined with warmer weather, offense has taken off. Before all is said and done, runs per game may spike to around 4.5 or 4.6, taking scoring to where it was in 2017.
It’s a mighty large adjustment to be happening mid-season. But the historical chart shows why it was necessary: sticky stuff has always been an issue in baseball, but over the last few years, there’s been a major change in how effective those substances have been. With the league’s enforcement ramping up, we’ll see what the game looks like on an even playing field, instead of one arbitrarily tilted towards the players and teams who were most willing to chemically engineer substances to maximize their RPM.


